

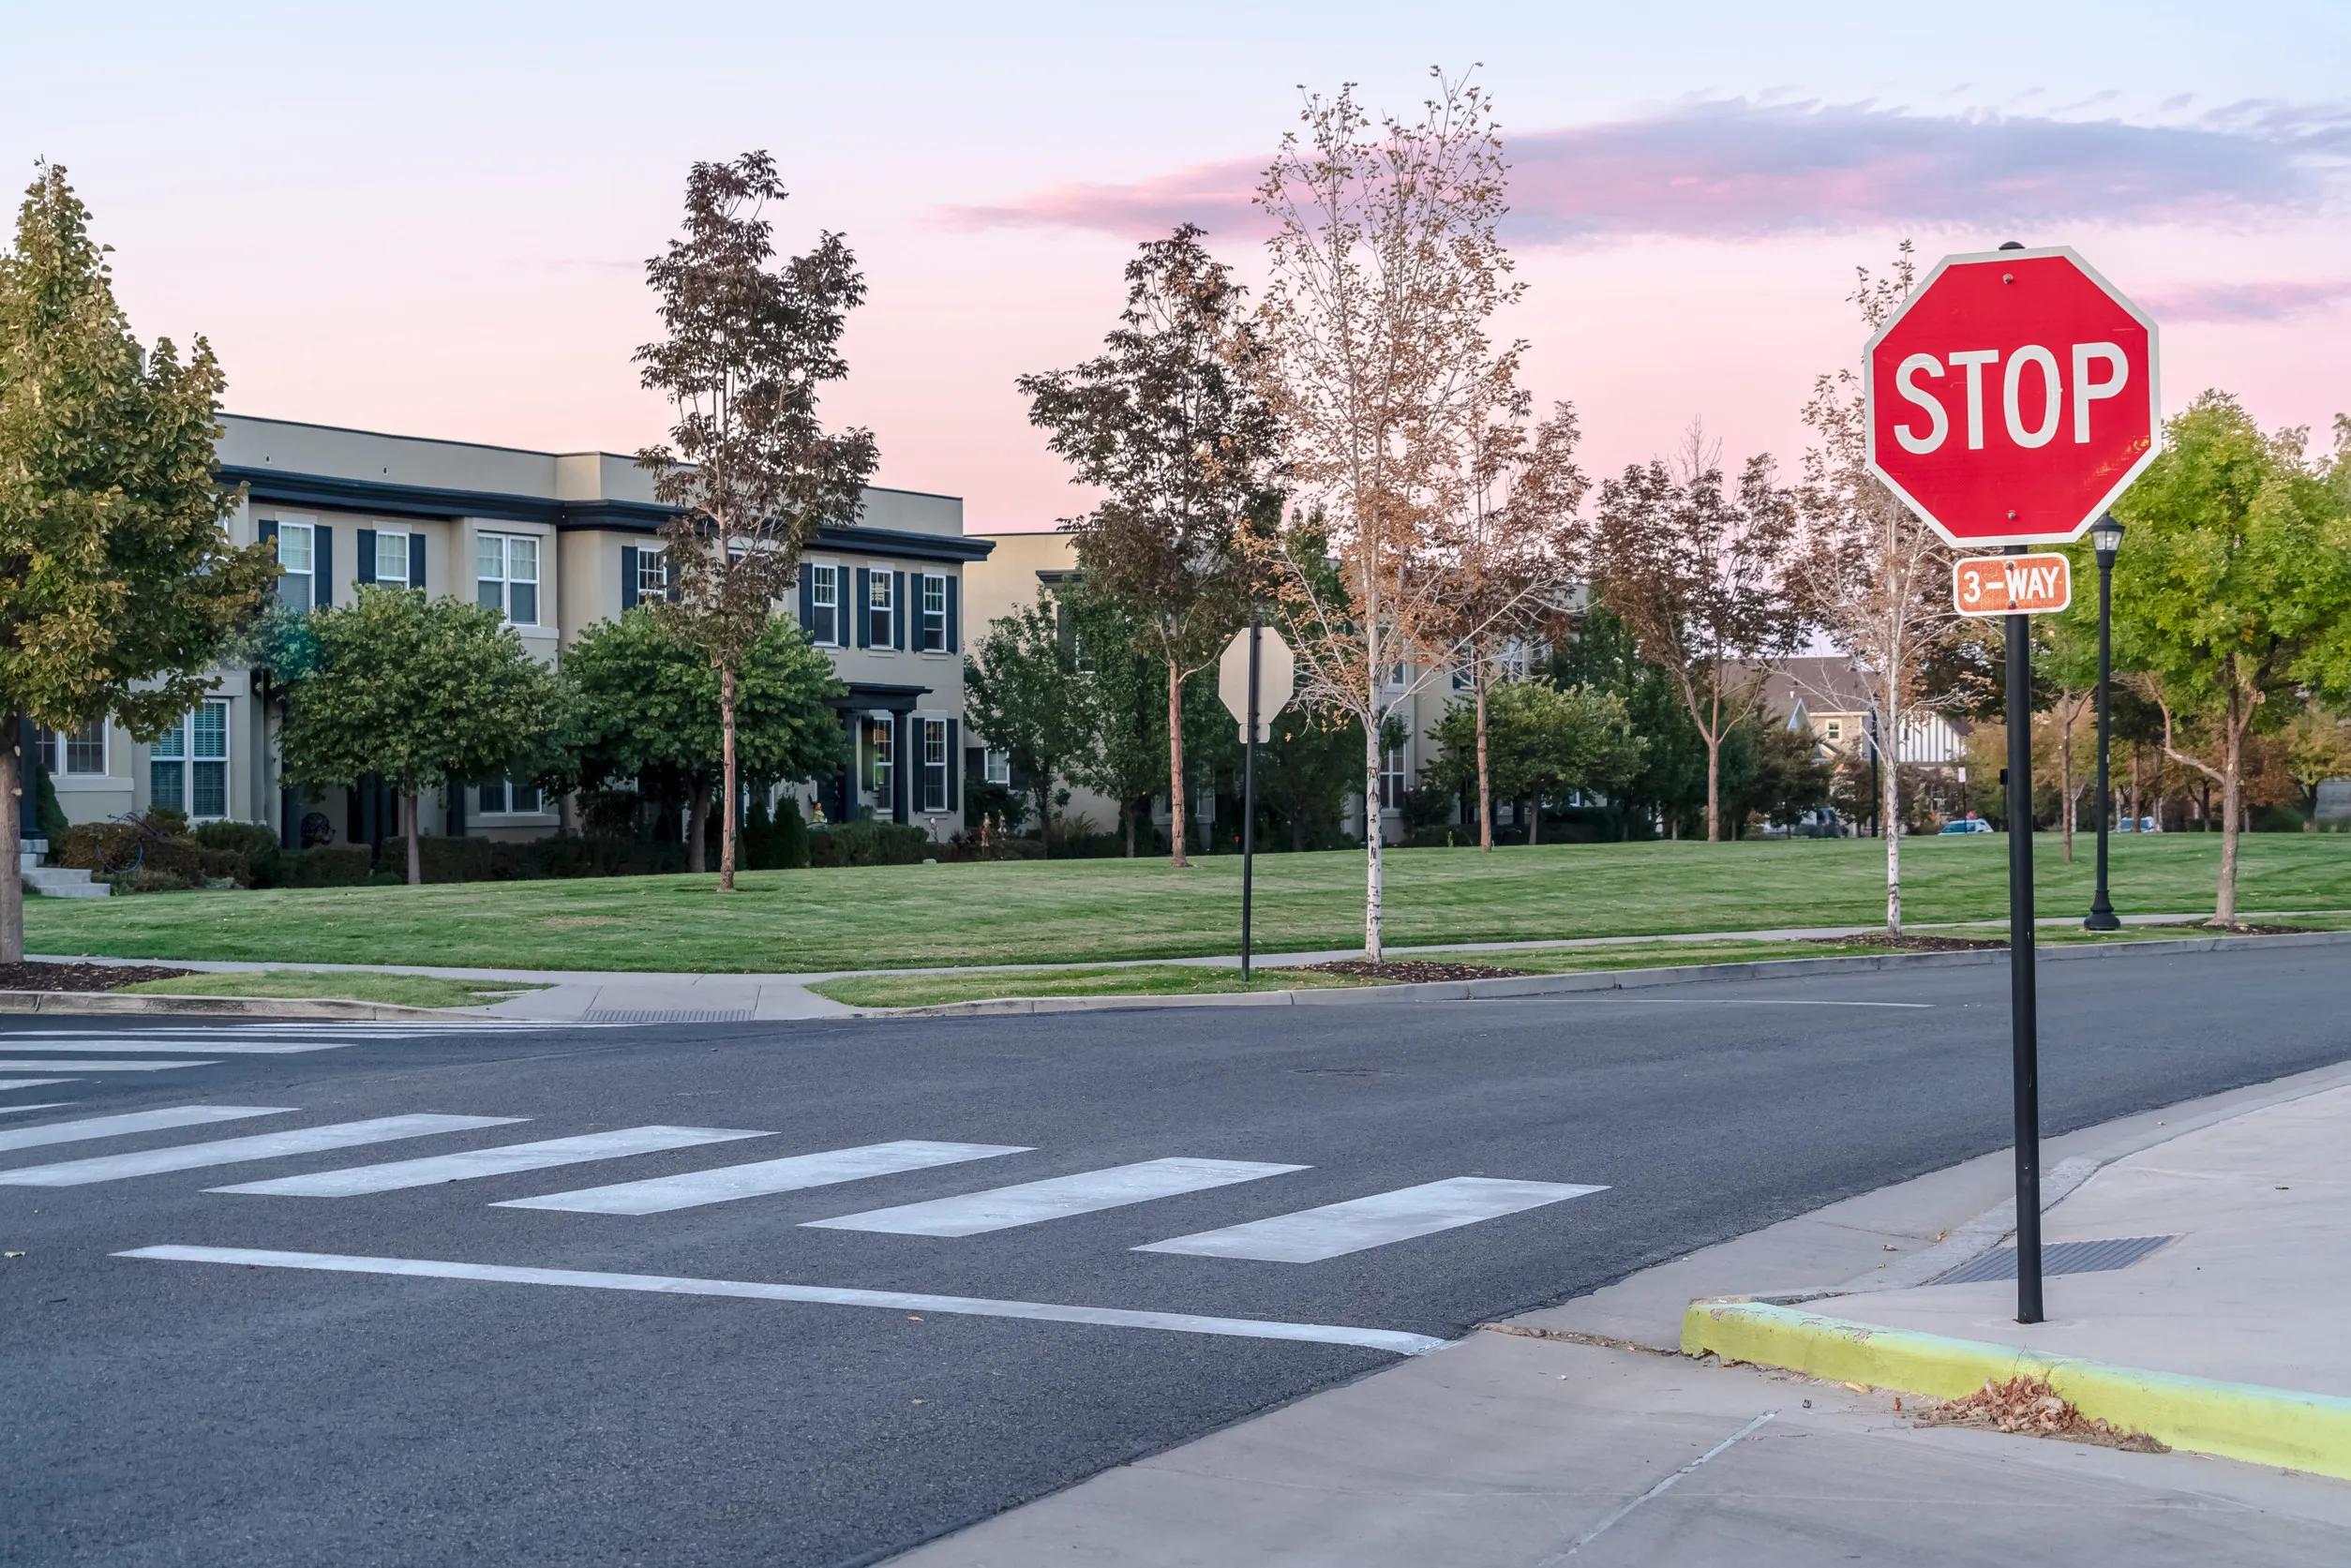
Baltimore neighborhood safety depends on five measurable factors beyond crime statistics: community engagement levels, physical design and lighting, school quality indicators, property maintenance patterns, and police response resources. Understanding these factors helps buyers evaluate genuine security rather than relying solely on crime data that often tells incomplete stories about day-to-day safety experiences.
Crime statistics provide a starting point, but neighborhoods with identical crime rates can feel dramatically different based on physical design, community cohesion, and the subtle environmental signals that either welcome or discourage criminal activity. Buyers who examine these five factors make more informed decisions about neighborhood safety than those who rely exclusively on published crime data.
1. Community Engagement and Social Cohesion
Strong neighborhood safety starts with residents who know each other, communicate regularly, and watch out for suspicious activity. Community engagement creates the "eyes on the street" effect that criminologists recognize as one of the most effective crime deterrents.
Key indicators of strong community engagement:
Active neighborhood associations that coordinate with police
Regular community events (block parties, cleanups) that strengthen neighbor relationships
NextDoor groups or Facebook pages where residents share safety information
Residents who make eye contact with strangers and remember unfamiliar vehicles
Long-term homeowners who know their neighbors by name
How to verify: Request access to neighborhood Facebook groups, talk to residents on the block about how long they've lived there, and look for community event announcements or watch signs indicating active organization.
2. Physical Design, Lighting, and Natural Surveillance
Neighborhood safety depends heavily on environmental design: the physical layout, lighting quality, and natural surveillance opportunities that either support or undermine security.
Jane Jacobs identified key principles of safe urban design: mixed use, short blocks, and concentration of people that provides "eyes on the street." Baltimore neighborhoods demonstrating these characteristics experience measurably less crime.
Critical physical design elements:
Street lighting quality (walk the neighborhood at night to assess)
Windows overlooking streets and sidewalks (natural surveillance)
Clear sightlines with minimal hiding spots from overgrown vegetation
Limited blind alleys or isolated areas offering criminals concealment
Front porches and entrances facing streets
Sidewalks in good condition that encourage walking
What to look for: Visit at different times (morning, evening, night) to assess lighting and activity levels. Walk the block checking for natural surveillance, can residents see sidewalks from windows? Note vacant properties, overgrown vegetation, or broken streetlights that create unsafe conditions.
3. School Quality as a Safety Indicator
School ratings correlate strongly with neighborhood safety because high-quality schools signal community investment, family-focused environments, and residents with long-term commitments to neighborhood conditions.
Why school quality indicates safety:
Families prioritizing education invest in properties long-term
School events create community connections among parents
Areas with strong schools attract stable homeowners rather than short-term renters
Communities organizing around school quality often organize around safety simultaneously
Check GreatSchools.org ratings for schools serving your target neighborhood. Schools rating 7+ out of 10 generally indicate communities with stability supporting strong safety outcomes.
Baltimore-specific consideration: Baltimore City and Baltimore County maintain completely separate school systems. County schools generally rate higher, creating safety implications. Six ZIP codes (21234, 21208, 21228, 21229, 21239, 21207) contain both City and County properties; verify which school district serves your specific property.
4. Property Maintenance and Investment Signals
Consistent property maintenance signals resident investment and community standards that support safety. Deteriorating maintenance signals residents who have stopped caring, which invites crime through the "broken windows" effect.
Maintenance indicators that predict safety:
Fresh paint, updated landscaping, new roofs showing long-term investment
Consistent lawn care and maintained sidewalks throughout the block
Minimal trash, debris, or abandoned items
Absence of boarded windows or properties in obvious disrepair
Recent home sales showing buyers investing in the neighborhood
Pay attention to maintenance cascades, one unmaintained property signals an individual issue. Multiple properties showing neglect signal neighborhood decline and increasing safety concerns.
What to observe: Count how many properties show recent investment versus deferred maintenance. Note whether issues appear isolated or widespread. Look for active renovation projects indicating neighborhood confidence.
5. Police Resources and Jurisdictional Differences
Police department resources, response times, and jurisdictional boundaries dramatically affect neighborhood safety in Baltimore due to the unusual City/County governmental split.
Baltimore City and Baltimore County function as completely separate entities with different police departments, different resource levels, and measurably different crime rates. Baltimore County Police Department maintains approximately 2,200 officers serving 860,000 residents across 612 square miles. Baltimore City Police Department employs approximately 2,400 officers serving 585,000 residents in just 81 square miles.
Despite similar officer counts, Baltimore City's concentrated density, higher call volumes, and complex urban environment result in longer response times and reduced proactive community policing compared to County areas where officers focus on prevention rather than constant reactive response.
Crime rate disparities between jurisdictions:
Baltimore City: approximately 58 violent crimes per 1,000 residents
Baltimore County: approximately 12 violent crimes per 1,000 residents (nearly five times lower)
Property crime shows similar gaps: City 47 per 1,000 vs County 18 per 1,000
These jurisdiction-wide averages obscure tremendous variation within each area, some City neighborhoods demonstrate County-level safety while certain County areas experience elevated crime. However, jurisdiction fundamentally affects the police resources, response times, and community policing models that support or undermine neighborhood security.
Critical verification step before purchasing:
Six Baltimore ZIP codes contain properties in both City and County jurisdictions. Buyers researching safety using ZIP code searches may compare City and County properties without realizing the fundamental differences affecting security. A property in the County portion of ZIP 21228 (Catonsville) benefits from County police response and lower area crime rates. An identical house 200 feet away in the City portion falls under different jurisdiction with different resources and higher surrounding crime.
Verify jurisdiction by calling the county/city tax offices directly, examining property tax bills showing the taxing authority, and checking which police district serves your specific address. Never assume ZIP code equals jurisdiction.
Action Plan: Verifying Neighborhood Safety Before Buying
Use this checklist to evaluate Baltimore neighborhood safety beyond crime statistics:
☑ Visit the neighborhood at different times: Drive and walk through on weekday mornings, weekday evenings, weekend afternoons, and weekend nights to assess how character and activity levels change
☑ Check crime mapping resources: Use Baltimore City (baltimorepolice.org) or Baltimore County crime maps to examine 12-24 months of incident data for your specific block, looking for clustering patterns
☑ Talk to current residents: Knock on doors near your target property and ask direct questions about comfort levels, crime experiences, and police responsiveness
☑ Verify City vs County jurisdiction: Call tax offices to confirm which government entity serves your property—never rely on ZIP code assumptions
☑ Assess lighting quality at night: Walk the block after dark to evaluate street lighting, natural surveillance from home windows, and overall visibility
☑ Research school ratings: Check GreatSchools.org and Maryland Report Card for schools serving the neighborhood as indicators of community investment
☑ Observe property maintenance patterns: Count how many properties show recent investment versus deferred maintenance to gauge neighborhood trajectory
☑ Join neighborhood communication channels: Request access to Facebook groups or Nextdoor communities to see real-time safety discussions among residents
For comprehensive rankings of Baltimore's safest neighborhoods with detailed crime data, school ratings, and buying guidance, see this complete Baltimore neighborhood safety guide. The guide analyzes 10 neighborhoods across Baltimore City and County with safety profiles, investment considerations, and verification strategies.
Understanding what actually makes Baltimore neighborhoods safe, beyond the crime statistics that often mislead buyers—helps you evaluate genuine security for your family and your property investment. The five factors above provide measurable, observable indicators that predict safety more accurately than crime data alone.
For a personal perspective on learning these lessons through 500+ Baltimore property purchases over 22 years, including costly mistakes and hard-won insights, read this investor's journey from City to County focus and why neighborhood safety ultimately determines investment success regardless of promising returns on paper.